Datatron
Dynamically Pricing Bay Area Transit Services
Leveraging machine learning to predict ridership and maximize pricing for local Bay Area commute services

Over the years, increasing traffic congestion in the Bay Area has prompted a shift towards more public transit and commute options. Various options such as BART, CalTrain, VTA, and Uber/Lyft are available, but individuals frequently spend more time and money by relying solely on a single commute option.
Ford Motor Company approached us with a request to help them bring machine learning to a new transportation service they were launching in the coming months. With a timeline of 1 month for design, development, and testing, I worked with our team to build a machine learning-powered dynamic pricing tool.
Company
Team


Goal
Ford came to Datatron with the question “How can we increase ridership while maximizing prices?
The goal of the project was to build a tool that uses machine learning to predict pricing and ridership for various Bay Area transportation services.
Process
With multiple directions to take, I worked with our data scientist and engineering team to research into the space and the features requested.
Research
Analyze Bay Area transit services
Understand how each Bay Area transportation and commute services operates in relations to factors that affect pricing and ridership.
Ideation
Breaking down the model
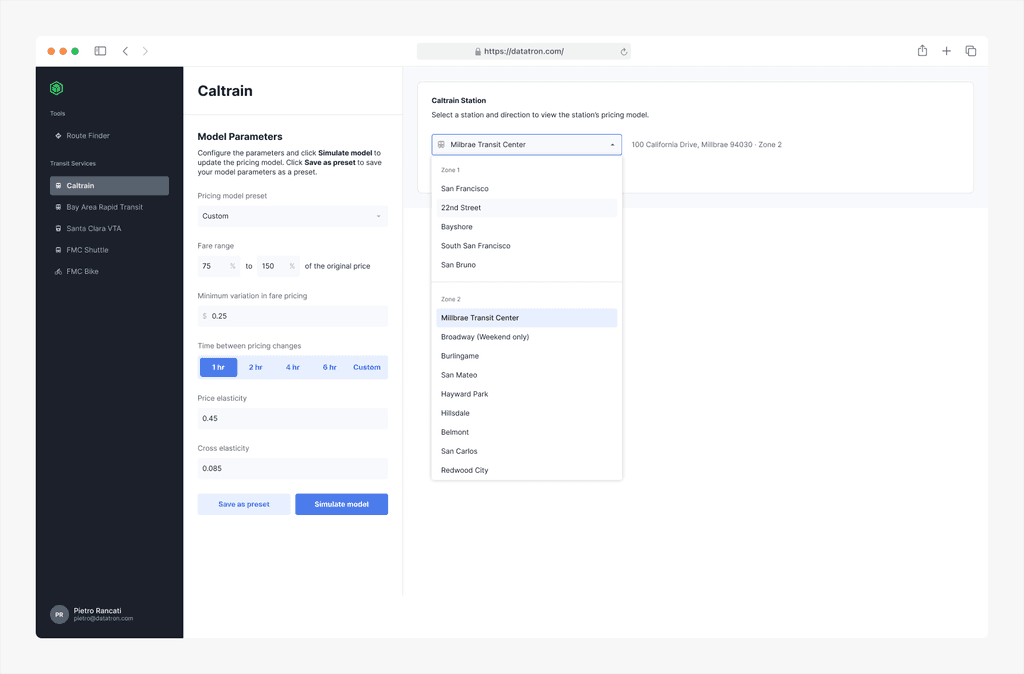
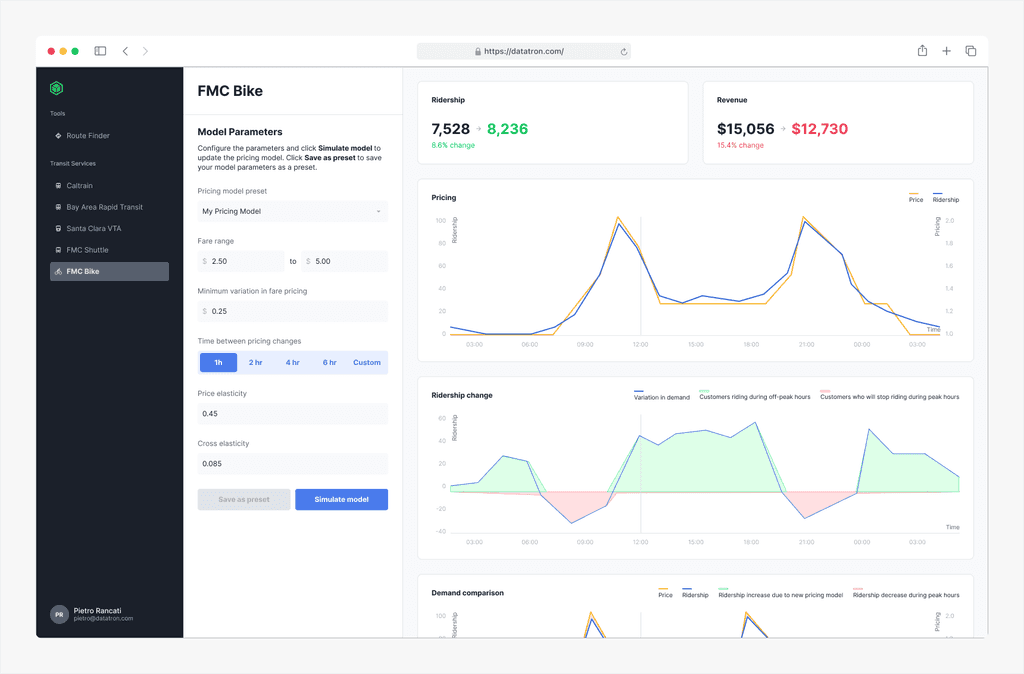
Work alongside our team to create a configurable UI that outputs dynamic pricing models from ridership parameters.
Research
Ideation
Analyze Bay Area transit services
The project had two phases: developing a machine learning model to determine ridership and designing an interface to consume and visualize the data provided by the model.
In a report, our data scientist Pietro summarized the effects of factors like seasonality, time of day, and geographic distribution on transportation services. The report provided the knowledge I needed to proceed with the UX of the tool.
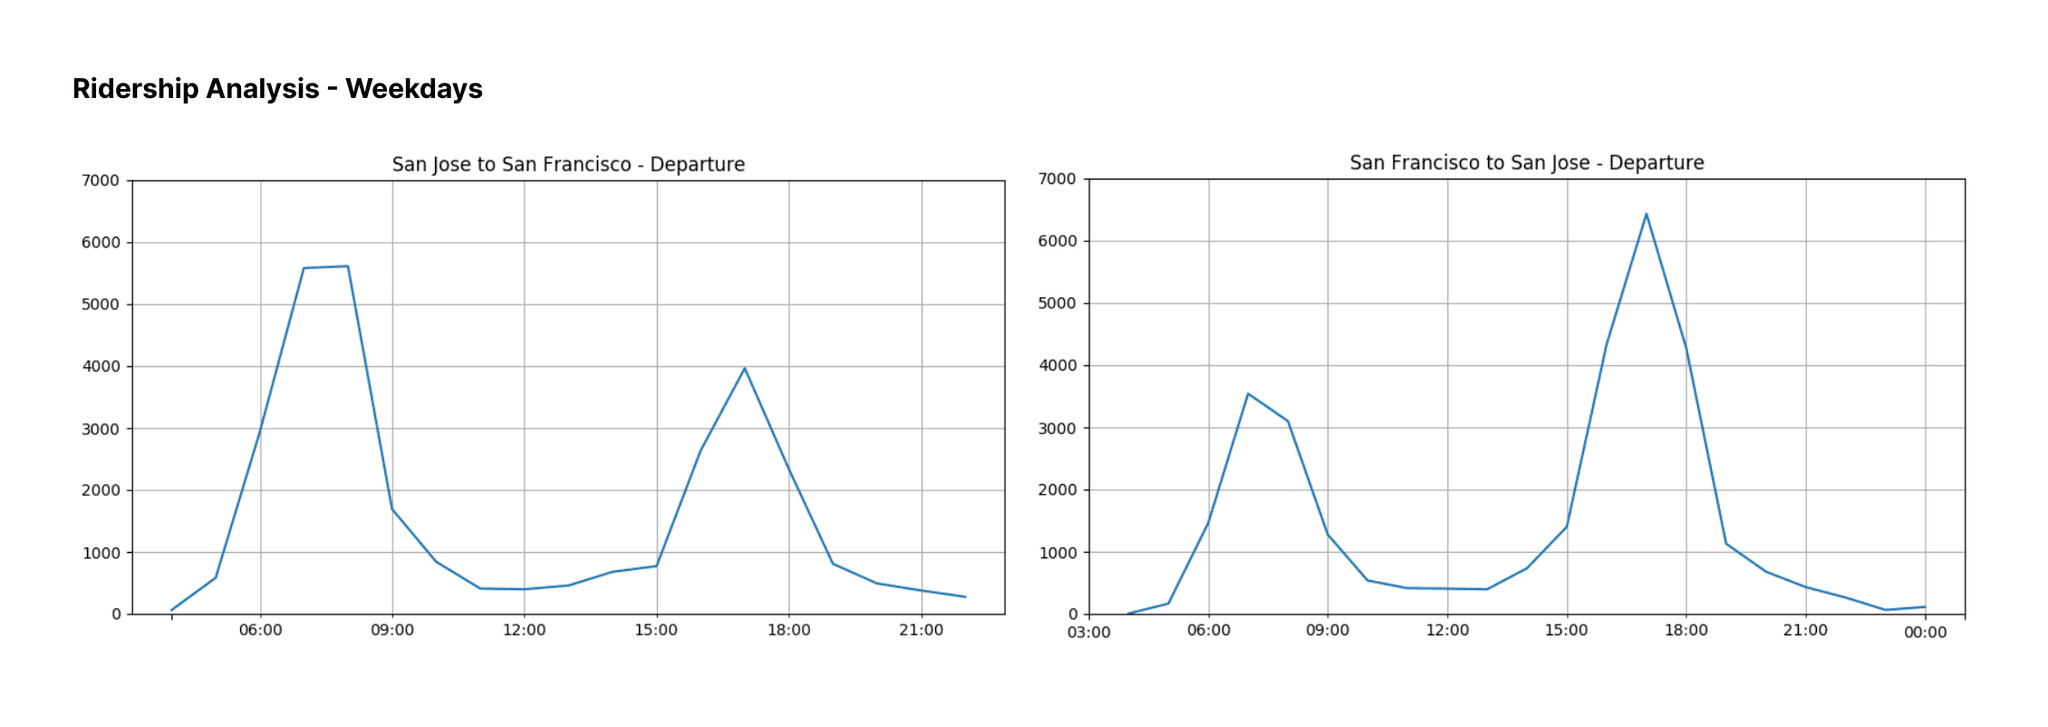
Caltrain ridership is affected by the time of day and the direction a rider is going during peak hours during a typical work week.
Research
Ideation
Breaking down the model
The interface was designed to allow users to configure a ride-sharing options that would provide an output model that Ford could use with their own service.
I worked with Pietro to identify the best approach to break down the model parameters as well as the data visualizations that plot the changes in ridership and pricing.